From mixing to bite: tracking structure in reformulated bakery products

Reformulating bakery products requires understanding how ingredient changes affect processing behaviour and final texture. Using muffin and gluten-free biscuit case studies, this article connects mixing consistency, oscillatory rheology, structural changes during heating and baked-product firmness.
The results demonstrate that greater mixing resistance does not necessarily produce a firmer product, while formulations with similar mixing consistency can exhibit markedly different deformation and texture characteristics. Combining complementary measurements across processing stages provides a practical framework for evaluating ingredient substitutions and guiding formulation development, with conclusions specific to the recipes and conditions examined.
Muffin and gluten-free biscuit experiments connect formulation, mixing, oscillatory rheology, heating and final texture. Their central finding is practical: greater mixing resistance does not necessarily produce a firmer baked product.
Why one measurement is not enough
Bakery quality develops through a sequence of structural changes. Mixing establishes an intermediate material; heating changes that structure; the baked product must then deliver the intended mechanical and sensory properties. The challenge is not simply to collect measurements at each stage, but to understand when their rankings agree and when they diverge. The muffin and biscuit results discussed here show why consistency, resistance to deformation, complex viscosity and firmness should not be treated as interchangeable measures of quality.
Experimental design
The muffin study compared a reference recipe, a reduced-oil control, a reduced-oil recipe with citrus fibre, and a reduced-egg recipe with a protein-based blend. The biscuit study compared a native-rice reference, a starch-and-fibre blend and two pregelatinised rice flours. These are complete formulation comparisons: the muffin recipes also vary in water addition, and the reduced-egg recipe has a different listed total batch mass. They do not isolate a single ingredient mechanism.
Analytical sequence and instruments
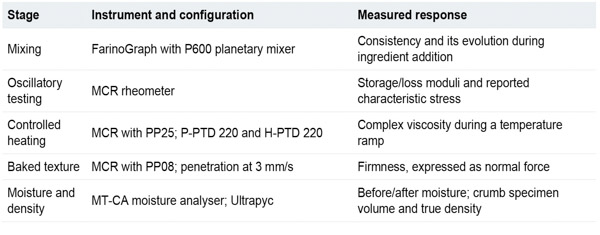
The instruments answer different questions. FarinoGraph mixing curves describe resistance during ingredient incorporation; MCR measurements distinguish deformation behaviour and changes during heating; penetration tests quantify the resulting firmness. MT-CA and Ultrapyc measurements add moisture and specimen-density information. The exact MCR and Ultrapyc model numbers are not specified in the masterclass methods.
Mixing: the measurement depends on process stage
Muffin preparation began with oil and sugar, followed by egg, powders, and finally water and glycerol. The original FarinoGraph/P600 curves show the strongest rise after powder incorporation and a pronounced drop after the final liquid addition (Figure 1). Reported consistency values were 272 BU for the reference, 266 BU for the reduced-oil control, 374 BU with citrus fibre and 719 BU for the reduced-egg formulation. These values describe the reported mixing peak, not the final discharge consistency.
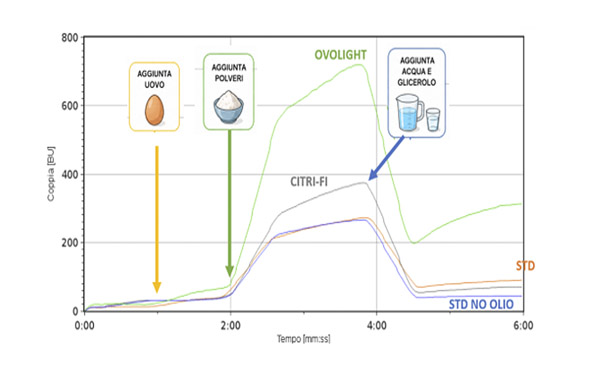
Figure 1. Original muffin mixing curves, measured with FarinoGraph and P600. Italian annotations identify egg addition, powder addition, and water/glycerol addition. The label “STD NO OLIO” denotes the reduced-oil control: its recipe still contains 90 g oil. Source: Food Masterclass, slide 9.
Resistance to deformation provides complementary information
The MCR oscillatory stress sweeps separate the same four formulations (Figure 2). The reported characteristic stresses are 0.10, 0.14, 2.02 and 7.54 Pa, respectively. Their order agrees with the mixing results. However, the source calls this parameter “Flow Shear Stress” in individual slides and “yield stress” in summary tables; the precise evaluation criterion should be confirmed before transferring the method.
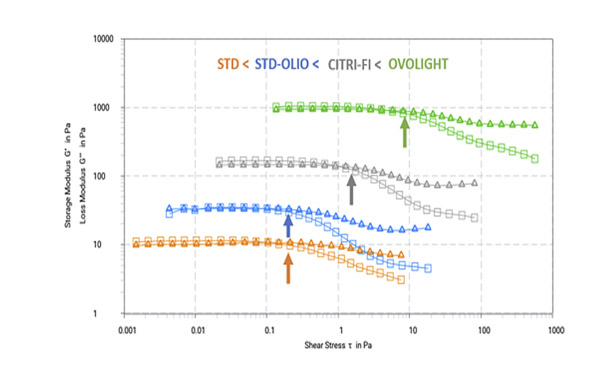
Figure 2. Original MCR stress-sweep results: storage and loss moduli versus applied shear stress. Source ingredient labels are retained. Citri-Fi identifies the citrus-fibre recipe; Ovolight identifies the protein-blend recipe. Source: Food Masterclass, slide 10.
Heating reveals a different structural ranking
Muffin samples were analysed with the MCR rheometer using PP25 plates, a 1 mm initial gap and 0.5 N normal-force control. P-PTD 220 and H-PTD 220 temperature-control components supported a ramp from 30 to 120 °C at 3 °C/min. The original curves show a relatively stable region around 40 to 80 °C, followed by formulation-dependent structural changes and increasing complex viscosity at higher temperatures (Figure 3).
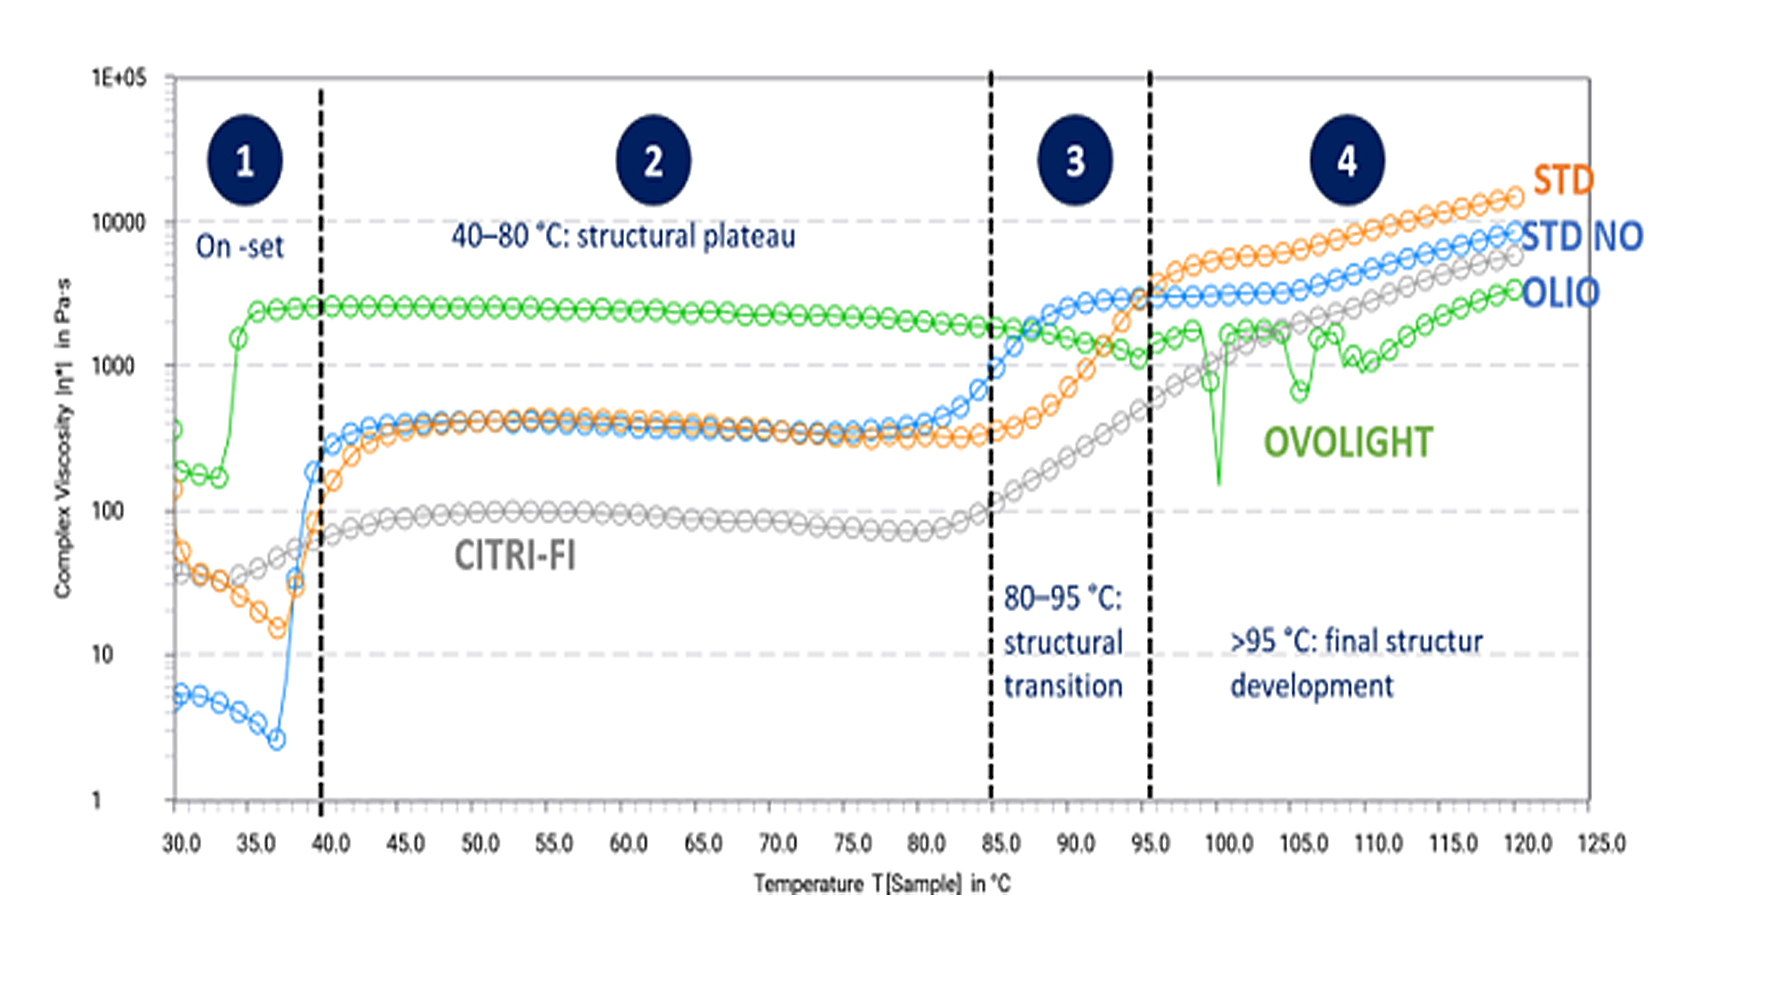 Figure 3. Original muffin heating profiles from the MCR rheometer. Complex viscosity is plotted on a logarithmic axis against temperature. The annotated temperature regions belong to the source interpretation; they are not independent measurements of individual molecular transitions. Source: Food Masterclass, slide 11.
The protein-blend formulation has the highest complex viscosity through much of the intermediate temperature range, but not at the end. The citrus-fibre formulation is more resistant during mixing than the reference, yet has lower complex viscosity through much of heating. These differences show that the measurement conditions and processing stage matter. The laboratory temperature sweep is also distinct from the documented oven bake: approximately 75 g muffin portions at 180 °C for 25 minutes.
From batter consistency to baked firmness
Penetration testing used the MCR rheometer with PP08 geometry at 3 mm/s. The reduced-egg recipe produced the lowest reported firmness, despite having the highest mixing consistency and characteristic stress. Conversely, the citrus-fibre recipe produced the firmest crumb. Table 1 brings these measurements together without implying that one directly predicts the other.
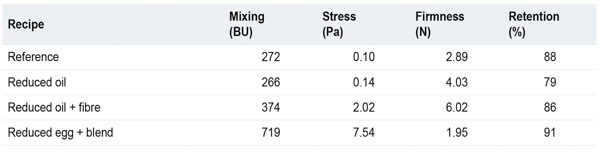
Reported moisture retention was highest for the reduced-egg formulation and lowest for the reduced-oil control. This adds context to the firmness results, but does not establish a causal mechanism or a shelf-life benefit. Water addition and the complete ingredient matrix changed alongside the measured properties.
Gluten-free biscuits: similar consistency, different bite
Each biscuit recipe contained 130 g egg, 130 g sunflower oil, 130 g sugar, 70 g water and 6 g baking powder. The reference used 534 g native rice flour. One recipe replaced 20 g of this flour with a starch-and-fibre blend; two others each replaced 70 g with pregelatinised rice flour. The documented process added water before oil and egg, followed by forming and baking at 180 °C for approximately 12 to 16 minutes.
FarinoGraph/P600 consistency was 547 BU for the reference and 1526 BU for the blend. The two pregelatinised flours gave similar values: 1814 BU for Y110 and 1778 BU for Y7510. Their reported MCR characteristic stresses, however, were 1810 and 5878 Pa, respectively. A comparable mixing target therefore concealed a substantial difference in the deformation measurement.
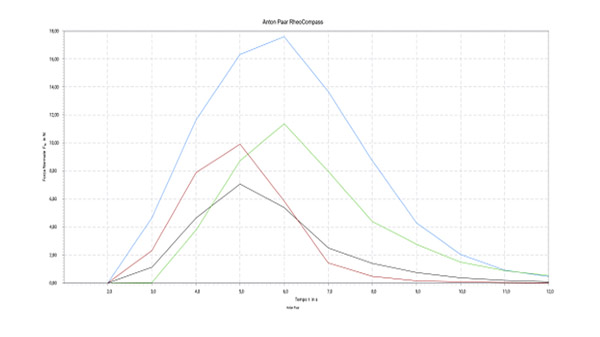
Figure 4. Original biscuit penetration curves: normal force (N) against time (s), measured with MCR and PP08 at 3 mm/s. Peak values correspond to the reference (9.92 N), blend (11.37 N), Y7510 (17.59 N) and Y110 (7.06 N) results. Source: Food Masterclass, slide 21
The final firmness difference was equally striking: 17.59 N for Y7510 versus 7.06 N for Y110, compared with 9.92 N for the reference and 11.37 N for the blend. Thus, the pregelatinised flours cannot be treated as interchangeable on the basis of mixing consistency alone. These results apply to the specific flour preparations, recipes and test conditions examined.
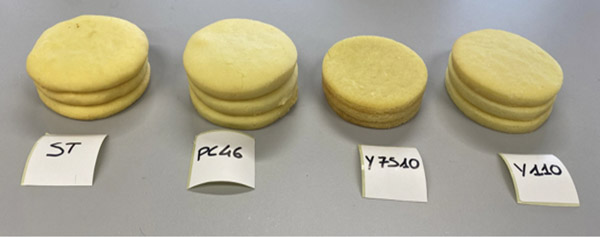
Figure 5. Original photograph of the biscuit samples, left to right: reference, starch-and-fibre blend, Y7510 and Y110. The crop removes empty worktop only. Appearance provides context, not a substitute for texture or sensory testing. Source: Food Masterclass, slide 21.
Formulation and processing both matter
Independent sponge-cake experiments provide a useful processing comparison. With whipping temperature at 30 °C, batter density was 359 g/L and baked volume yield was 479 cm³ per 100 g batter. At 40 °C, density increased to 440 g/L while volume yield decreased to 362 cm³ per 100 g. The source associates the hotter condition with reduced viscosity and poorer gas retention. The same report also shows that whipping-tool geometry changes the pore pattern. These are recipe-specific findings, not universal optimum temperatures.
A separate gluten-free workshop compared whole-buckwheat and rice biscuit formulations using FarinoGraph/P600 and an MCR rheometer. Mixing development times were 1 minute 58 seconds and 3 minutes 10 seconds, with consistencies of 610 and 1210 BU. Subsequent texture testing with a 25 mm probe gave peak forces of 6.10 and 13.26 N. The parallel mixing, heating and texture measurements support the same analytical sequence, but these forces must not be pooled with the masterclass results obtained with an 8 mm probe.
Where wheat-dough testing fits
For wheat dough, the related reports describe complementary FarinoGraph mixing, ExtensoGraph stretching and Amylograph starch-heating measurements. The stretching work follows resistance and extensibility after 45, 90 and 135 minutes of resting, making time-dependent formulation effects visible. These methods supply useful flour-quality context. ExtensoGraph and Amylograph were not reported as instruments used in the muffin and rice-biscuit experiments discussed above.
Interpretation requires limits as well as results
The masterclass correlation matrices underline the need for product-specific interpretation. The reported correlation between mixing consistency and characteristic stress is 0.9996 for muffins but only 0.226 for biscuits. Each matrix contains four formulation-level comparisons. Such coefficients describe these small datasets; they do not establish a general prediction model, causality or statistical significance. The source also does not define the reported plus-or-minus values or state the replicate count for these formulation results.
Ultrapyc data require similar care. The source reports crumb specimen volumes and values labelled true density, rather than a separately documented whole-product volume or air-cell distribution. Those numbers should retain their original measurement description. Likewise, the reported moisture-retention percentages should not be converted into claims about freshness, water activity or shelf life without an appropriate storage study.
A practical conclusion
An effective development workflow links the mixing curve, deformation response, heating profile and baked texture to the same formulation. Define the measurement endpoint, preserve test geometry and temperature conditions, and validate the preferred recipe through baking and sensory assessment. The aim is not maximum consistency or maximum firmness, but an appropriate balance for the product and process. The experiments demonstrate the value of complementary measurements precisely because their rankings do not always agree.
About the author
Dr Banu Sezer holds BSc, MSc and PhD degrees in Food Engineering from Hacettepe University, Türkiye. She is Market Development Manager for Global Food and Feed at Anton Paar GmbH, with more than a decade of experience in food production, quality control and engineering.
TECHNICAL APPENDIX
Formulations and reported results
Muffin recipes shared 280 g flour, 223 g sugar, 20 g glycerol, 15 g baking powder and 2 g salt. The recipe keys below retain the ingredient quantities in the masterclass formulation table.

Table A1. Muffin formulation variables, in grams. Listed totals are 1000 g for M0, M1 and M2, and 900 g for M3; these totals are calculated directly from the supplied recipe table.
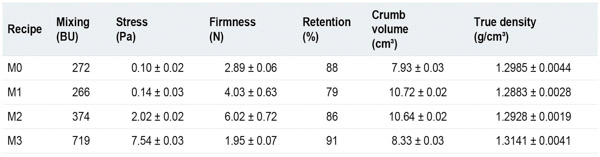
Table A2. Muffin results transcribed from Food Masterclass, slides 9 to 15. “Stress” retains the source values; the evaluation terminology differs between individual and summary slides.
Biscuit recipes shared 130 g egg, 130 g sunflower oil, 130 g sugar, 70 g water and 6 g baking powder. B0 used 534 g native rice flour. B1 used 514 g native rice flour and 20 g Starbase PC46. B2 and B3 each used 464 g native rice flour plus 70 g pregelatinised rice flour, Y110 and Y7510 respectively
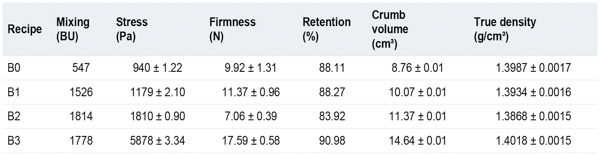
All plus-or-minus values are reproduced as supplied; their statistical definition and the associated replicate counts are not stated. The volume and density columns describe the reported crumb measurements, not an independently documented whole-product volume. No numerical thermal curves were reconstructed from screenshots.
